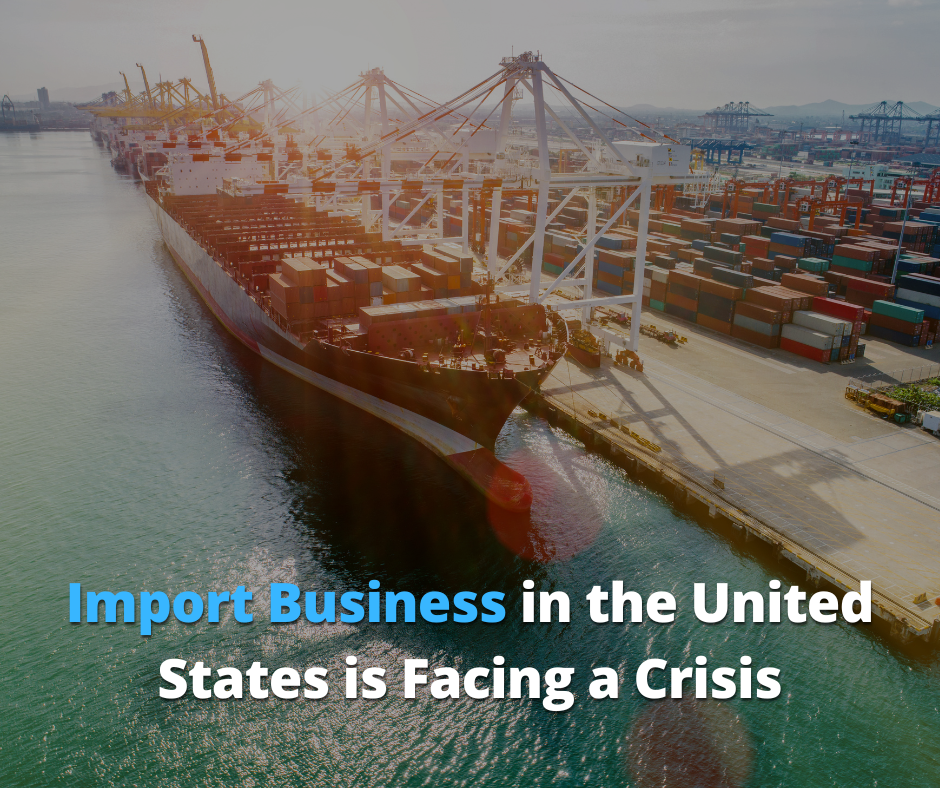
Recent data shows that the import business in the United States is facing a crisis, one which is likely to impact the global supply chain. In September, US imports suffered the largest drops since the COVID-19-related lockdowns of 2020. Information from Descartes Systems Group indicates that imports were down by 11% from September 2021 and 12.4% less than the previous month of August 2022. This comes after a pullback in spot shipping rates following a historic peak. At the same time, Asian bookings were plunging and the industry was dealing with massive retail order cancellations.
The effects begin to show up on American ports
Once spot rates began to fall and bookings started to be canceled, it was only a matter of time before imports would be pulled back. September recorded 2,215,731 twenty-foot equivalent units worth of imports. This can be translated into a 313,311-TEU decline when compared to August – the steepest month-on-month decline since February 2020, when Chinese authorities first put Wuhan into lockdown. Descartes’ Chris Jones sees this as a significant correction.
September often sees seasonal reductions in imports. However, this level of decline is unusual, leading some experts to suggest that we’re still witnessing the after-effects of global COVID-19 measures. If seasonal patterns are to hold, then this slowdown will run to the end of the year. All three coasts of the USA are recording these declines, so this is not a localized issue. This summer, overall US imports reached near-record levels even as volumes on the West Coast were declining; the significant gains on the Gulf and East coasts more than compensated for the fall on the West coast. Indeed, shippers had been moving their cargos towards the east for fear of labor unrest on the West coast as well as the usual peak season on that coast, which can lead to significant congestion.
Differing experiences across ports, but same trends
One of the most surprising of last month’s drops can be seen in Savannah, Georgia. Here, the fall was from 285,341 to 223,966 TEUs – a staggering 21.5%. This was especially unexpected given that Savannah had been the biggest winner of the eastward shift in traffic and had therefore posted record imports in August. Indeed, the coast had the longest queues of waiting ships in the USA for months, and data released just this week shows that there are 35 ships still waiting.
A spokesperson for the Georgia Ports Authority (GPA) named Hurricane Ian as one factor underlying the decline; vessel service was suspended for about three days, which could explain the ongoing congestion despite the sharp decline in imports. GPA is accommodating all these changes and they will be reflected in the October numbers. Nevertheless, there is some disquiet about conflicting figures coming out of the industry.
Questions about statistics and their implications
The official data released by South Carolina Ports is not entirely consistent with the trends suggested by Descartes’ statistics. In fact, South Carolina Ports indicated that loaded imports had increased by 16% when compared to September 2021. The implication is that the import volumes at Charleston were flat when compared to August. This directly contradicts Descartes, which indicated that imports during the same period had fallen by 6.5% when compared to August 2021.
Additional data inconsistencies arise when comparing Descartes with PIERS, which is owned by S&P Global. For example, PIERS suggests that the decline in US imports was only 0.8% in a year-on-year comparison. This could be because PIERS calculated the September 2021 imports at a much lower rate than the formula used by Descartes. However, the calculations for September 2022 are the same as Descartes. Hence, PIERS indicated an 8.2% sequential drop in September compared to the previous month. This is a lower figure than the 12.4% indicated by Descartes.
These statistical contradictions are exacerbated by the fact that the import data is compiled by Panjiva, a subsidiary of S&P Global. The Panjiva data is consistent with the information coming out of Descartes. Yet, both these outlets are providing data that conflicts with information from PIERS. Such inconsistencies may raise questions about the estimations and inferences made from the data.
Meanwhile, volumes from China are collapsing
The reduction in US imports is consistent with collapsing volumes from China. Descartes indicates that volumes from China during September were only 820,329 TEUs. This represents a 22.7% fall from September 2021 and a fall of 18.3% when compared to August 2022. Experts suggest that declines in the China segment of imports accounted for nearly 62% of the drops experienced in September compared to August 2022. Chinese lockdowns are not helping import volumes despite the lag effect between lockdowns and import declines.
There is a combined but slightly staggered effect of initial demand weakness which is later reflected in import data weakness. The lags may start at the origin of merchandise and then slip through as America struggles to deal with shipping queues. Imports remain a lagging indicator due to changes in lead times, a consequence of supply chains that have been significantly extended. The Booking index has now fallen from the heights of the COVID-19 era. Perhaps the declining imports present an opportunity for the US coasts to deal with pending backlogs. Nevertheless, the supply chain crunch remains a real problem that does not yet have a satisfactory solution.
Wrapping up
The experts anticipated a decline in imports across all three coasts of the USA. However, the level of declines has now exceeded expectations. The blame can be laid on the slowdown in demand as well as the supply chain rigidities that China has been dealing with since the COVID-19 pandemic. One positive aspect is that this lull can give ports the opportunity to deal with the backlogs they have been carrying for months. However, many experts believe the current situation foreshadows significant changes in the logistics and shipping industry.


One Comment on ““Import Business in the United States is Facing a Crisis””
This is a fantastic and timely article. The insight into the challenges facing the import business in the United States is spot on. I particularly appreciated the analysis of supply chain disruptions and their impact on businesses. Your suggestions for navigating these challenges were very practical and valuable.